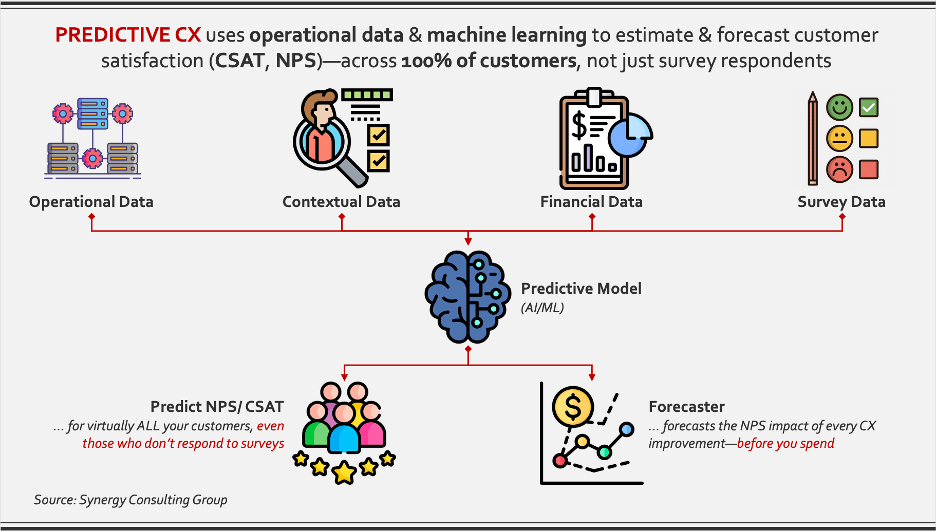
Predictive CX uses machine learning to estimate customer satisfaction (NPS, CSAT) for nearly 100% of customers—without relying solely on surveys. See how leading companies turn operational data into real-time predictions, automated interventions, and quantifiable ROI from CX improvements.


CUSTOMERS NOW CHANGE BRANDS WITH A TAP, broadcast bad experiences in seconds—and 85% never fill out a survey. Predictive Customer Experience (Predictive CX) flips the model: it reads every click, call log and payment in real time, anticipates defection risk, and intervenes before frustration surfaces (see Exhibit 1). CX-Mature organizations are already cashing in: a European telco cut churn 15%1 and added €37 million EBITDA; a global fashion e-retailer now drives ~40% of online revenue through ML-powered suggestions.
Explore how CX maturity pays off in our white paper, From Satisfaction to Emotionally Connected
See how digital infrastructure enables scale in our white paper, Digital Transformation Imperative
Exhibit 1: Predictive CX—How operational data powers always-on sentiment estimation
Predictive CX moves the P&L along three dimensions that compound over time:
Those gains reinforce each other—the more data you act on, the better the model gets, and the wider the gap grows (see Exhibit 4 for the value formula).
Identify the one journey that can shift EBIT fastest and ring-fence the talent and data access required to start the pilot this quarter. Early movers are already compounding a proprietary insight advantage; laggards risk watching the data moat deepen.
Predictive CX has moved beyond “interesting analytics” to become an a data-driven decisioning tool that links customer delight directly to revenue, cost and valuation. The only strategic question left is how quickly leadership chooses to build it.

See if our Customer Experience Management and Data-driven Decision Making Consulting Practice can help you.
1 Realized over twelve billing cycles; monthly run-rate uplift is ~€3 M once steady-state adoption is reached.
2 This is a typical range, not a universal constant. The ratio is drawn from multi-industry studies with controls for ARPU and tenure.
If you have questions about how Synergy Consulting Group can help you develop strategy – please
